日志
论文实例
||
It’s that time of year again, we are expected to help Santa to find a best strategy to pack his sleigh. The key to solving the problem lies in making standards to measure what is the best and method to formulate presentpacking strategy. A common evaluation for packing Santa’s sleigh is given in the test questions, which is regards as reasonable to our mind. So in the article, our major target is to formulate a suitable packing strategy, making the presents as compactly as possible and in the best order possible.
We mainly formulated three strategies for packing sleigh. Strategy 1: Every fixed number (T) of presents in order are grouped. In each group, the presents are divided into big-size category and small-size category, according to whether their longest side-length are beyond Classification (K). When packed, the present in big size will gain priority.
Strategy 2: define a compact degree (d) to describe a present is suitable with the available space .Every present should be pack in the way to make the degree to the best.
Strategy 3: we should put the present in the lowest place from all regions, but we also search the higher level when the lowest place can not enough for the present’s size. Then we put forward two optimization strategy to reduce the computational complexity of the model:one is to give up the small gap; the other is to optimize the unavailable space,and we get the final model.
Then we take the first 1000 presents of the list as sample to test the model and analyze the parameters.As the result,we get the minimum value of M when the length of group T =10,the classification boundary K=2,and the compact degree d=9.
Finally,we apply the model with the best parameters to calculate 30000,100000 and 1000000 presents ,and we get the corresponding M value respectively,these are 56261,186734 and 1862431.We also analyze the strength and weakness of our model.
Key Words: packing problem; classification; compactness
1
1 IntroductionChristmas is coming, Santa needs an optimal loading mode, makes the present as compact as possible and orderly arranged in the sledge. The title gives an evaluation on the best standards, we think it is effective, our objective is based as much as possible to determine an optimal loading method.
This is a space layout optimization problems[1, 2, 3], and is similar to the classic container loading problem . Container loading problem aims to determine the loading strategy as far as possible to make maximum utilization of the container space, solution method often used to have a constructive heuristic algorithm, using genetic algorithm, ant colony algorithm, tabu search algorithm and other intelligent algorithm. But in the Santa Claus present loading, we not only need to make a present the placement space utilization rate of the highest possible, should also be possible to make the place as far as possible the orderly, the existing methods are not applicable, we need to have characteristics determine a suitable method.
Now,we will show our work in the paper:
• We first establish three present placement strategy.
• According to the strategy to establish the corresponding present display model.
• We carried out experiments on each parameter in the model, to find the best parameter value.
• We use the modified model to calculate the number of presents on the subject are given, to obtain the result.
• We use the results of analysis to discuss the basic placement strategy, and to discuss the rationality of definition of the optimal index analysis of the given topic.
2 Assumptions and interpretationThe mutual extrusion will not attribute to the deformation among presents. In this paper, the main purpose is to give the best present loading method, considering the close degree and order. The mathematical description that presents produce extrusion deformation is very complex. To establish the mathematical model to facilitate the solution, we think that the mutual extrusion will not generate deformation.
Any present placed state is stable, the present will not collapse. In fact, the center of gravity when the top present below on the outside surface of the present, the whole structure will collapse because of the unstable. Establish the process to simplify the model to reduce the computational complexity, we assume that an arbitrary state display process is stable.
Put any position is from bottom to top. Because of gravity, articles must be from the bottom up, not hanging put presents, which is more consistent with the real situation.
Under the above and basic assumptions, we can set out to construct our model.
3 Establish strategy and build models3.1 How to put presentsLoading of a certain number of objects to the sleigh, we make it as compact as possible, and try to make it orderly.A straightforward idea is to put some big size of the presents first, and then put the small size into the gap.For each of the presents ,we can adjust their attitude to find the most appropriate way. Each gift put can start from the lowest place, this can make the sleigh more smooth and more compact. To this end, we put forward the following strategies.
• Group a certain number of presents, and each group by size within into two kinds of size, large size in a first, put the small sizes after.
If the ideal sequence to put can produce many small gap, not only reduce the space utilization, and increased a lot of judgment, make the algorithm complexity has greatly increased. We can group first, classify after , and then put according to the strategy of the large size class first, small size class after .This not only can effectively makes use of gaps, but also greatly reduces the complexity of the algorithm.
We divide each of T presents into a group. When we put n presents, the next group can be showed as the available set G{gn+1,gn+2,...,gn+T }.
Through the statistical analysis for the given presents size ,we can see the analysis results as shown in Fig3.1.
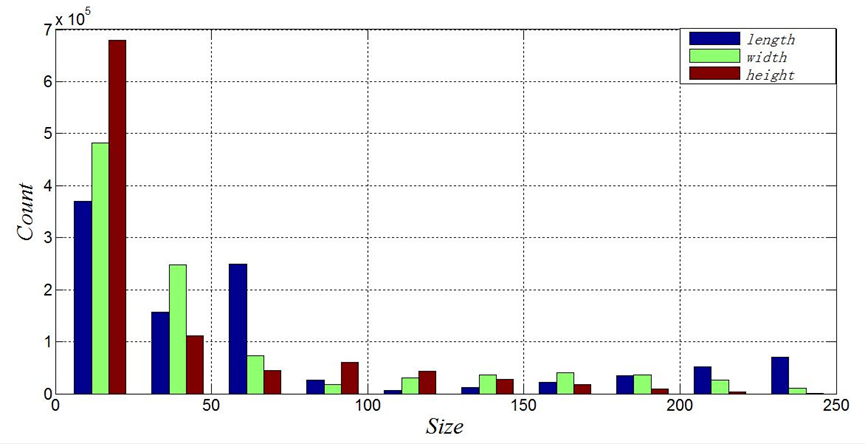
From the chart , the each side length of the majority presents is less than 10 ,which can be a boundary to divided them into large size and small size.
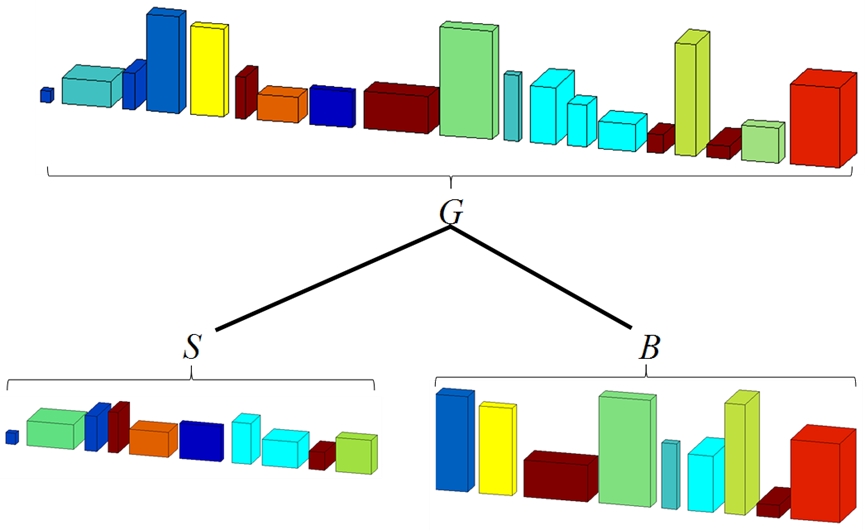
Large size and small size can be respected by the set B and S.The classification diagram as shown in Fig3.2.
Set the n + k presents of length, width and height, respectively, and can be expressed as un+k,vn+k,wn+k.Thus the classification method can be described as
k=T
S = Xgn+k [S,min{un+k,vn+k,wn+k} ≤ K k=1 | (3.1) |
k=T B = Xun+k [S,min{un+k,vn+k,wn+k} > K | (3.2) |
k=1
In the equation,let the parameter of classification K = 10,and n+k < N,N is the number of the presents.
• For each presents, use the highest degree in areas relevant to put.
Presents put to is parallel or orthogonal with the sleigh.In this way,it can be put there with 6 kinds of gestures.The placement attitude as shown in Fig3.3.
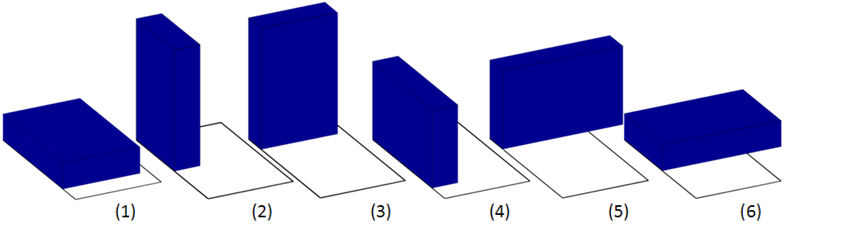
We select a way,in which,the present is the most revelent to the space , such as the way(1). Such is helpful to reduce the gap,and improve space utilization. Define the first k kinds of n +1 present placed for relevant degrees:
Let the k kinds of n+1 presents of the length and width be , Pn+1k,Qn+1k ,and respectively for the current put coordinates (x,y) identified put area’s long and wide.
• All regions can be put in the lowest prior.
First determines the lowest place whether there is a space to satisfy the next present put, if meet in here, if not satisfied, in the area of the penultimate lower judgment, until find one can be placed. Generally, at the lowest space,we may find different kinds of spaces to choose .For this we take from left to right, from top to bottom of the order and search one by one. Put this method can be realized by matlab in min function:
hmin = min(min(Hn)) (3.3)
Through the operation after hmin said ,its returns coordinates (x,y).
At the lowest priority put can avoid the bad situation of local high produce, which is beneficial to make full use of the remaining space, can effectively improve the tightness that puts.
3.2 Record and update the space stateWhen we put presents in the process of the sleigh, records of space state is necessary, so that we can choose which space to the next present according to a certain strategy. We supposed that the display is always from the bottom up, but in fact, we just need to be concerned with the state on the surface of the space. Because the sleigh is for 1000 units of the square and the size of the presents is an integer, after put n present ,the state of space may be defined as:
zni,j,(0 ≤ i ≤ 1000,0 ≤ j ≤ 1000)is said the point (i,j) corresponding to the highest surface on the height of the object after putting the n presents.
Set the n + 1 present of length, width and height as un+1,vn+1,wn+1 respectively.when we put it in space on the surface, at a certain point (x,y,znx,y),the height of the space will be updated to
zn+1x,y = znx,y + wn+1 (3.4)
After the n+1 present,we can get the state space description matrix Hn+1.
The n+1 space status update operation is defined as in+1, after putting the n +1 present, status updates can be described as
Zn+1 = in+1Zn+1 (3.5)
Thus when the M update to the following value after putting the n + 1 present.
Mn+1 = Mn +2(Zn+1max − Znmax)+ | n +1 = in+1actual | (3.6)
in+1actualis the n +1 presents actual order in the ideal order.Space state tran-
sition diagram is shown in Fig3.4.
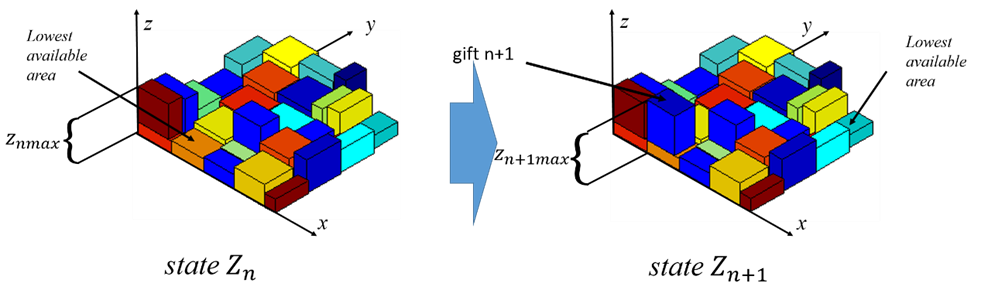
Figure 3.4: Space state transition diagram
3.3 The improvement of modelSuch problems have been shown is NP - hard problem[4,5,6],and because our model is relatively ideal, computational complexity is too big that it is hard to solve. Here we will analyze a few of the main causes of computational complexity and improve our model for reducing the complexity of the calculation.
3.3.1 Give up small spaceAfter the present put on the available space,it will be set apart as gap 1 and gap 2 space, as shown in Fig3.5.Too much gap will produce a large number of search points, that will increases searching complexity seriously .
To solve this problem, we can give up some small space to reduce the searching complexity. So if for any rectangular space,the shortest edge is less than the given close degree dmin,it is considered to be not used. Judge expression as follows:
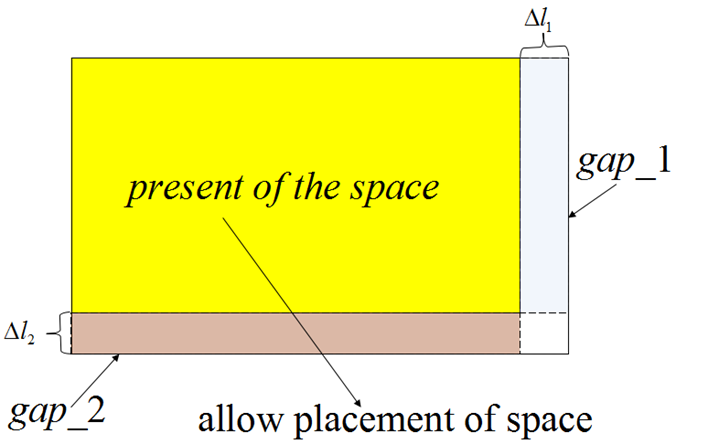 gap 1(or gap 2) is unavailable gap 1(or gap 2) is available
Unavailable space:If present gn is unable to put into the available space and need to choose the next available space, the space becomes unavailable space at this time.when we put into the present gn+1, we will restore the unavailable space .
Due to Min function is to search the global minimum altitude, you need to tag searched space not used to avoid repetition. Fuzzy problems exist in the change with unavailable space, so we will make a strategy.
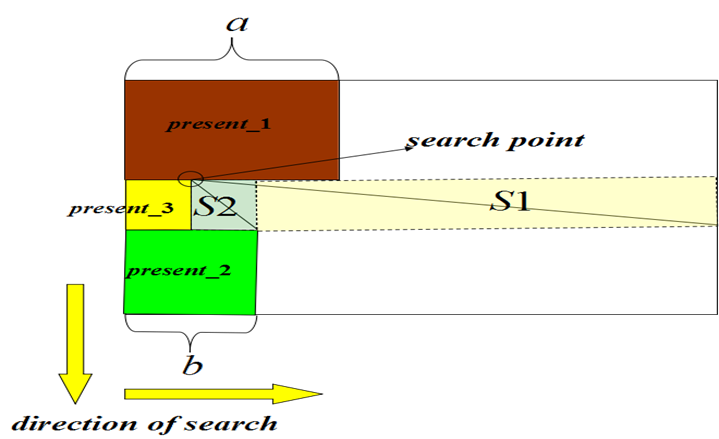
The fuzzy problems is shown in the Fig3.6 .The direction of searching is down and to the right , that can make the search point spread out and produce two spaces {S1, S2}. If we changed the space of S1, the quantity of state will ba tagged and S1 is unable to use at next searching.To avoid this situation ,we take the shortest length of the space as the boundary of the unavailable space. Because the upper length a is less than the lower length b,we define S2 as unavailable space.
4 Testing the ModelWe take 1000 presents as the research object,and count up the 3d length of 1000 presents.We find that the statistic of 1000 presents is same of the 30000,100000 and 1000000 ,so we can say this testing is meaningful.
The calculation flow chart is shown in Fig4.1:
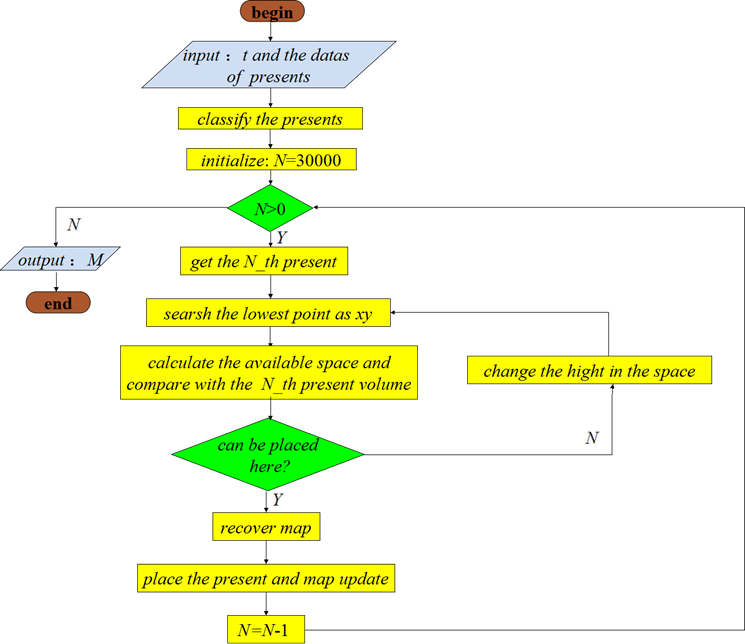
Figure 4.1: The calculation flow chart
For the best answer,we should test some parameters of the model.
4.1 Parameter analysis4.1.1 Classification KWhen we research category boundaries K influencing on the result, we need to consider the indicators of different scales. In order to highlight the change trend of each indicators , the results after normalization is analyzed.The result is shown in Fig4.2 :
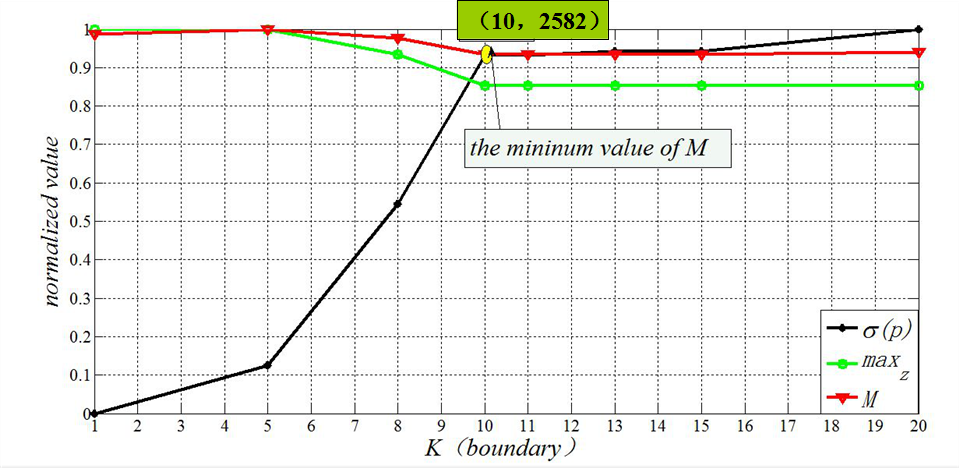
We can see from the figure that ,the minimum value of M is obtained at K = 10, at the same time, the change of K on the impact of the various indicators:
1. With the increase of K, the order of evaluation indicators σ(p), rapid growth and then slow growth ,and in K = 10, there is the rate of change;
2. A maximum height of Maxz in a trough at K = 10 ,after that height changes little;
3. M there was a minimum value M = 2582 in the K = 10, later along with the change of K, M value is basically the same.
4.1.2 Packet length TParameters T (branch length) in the model influence the order , to test the results of T with different values ,the result is shown in Fig4.3 :
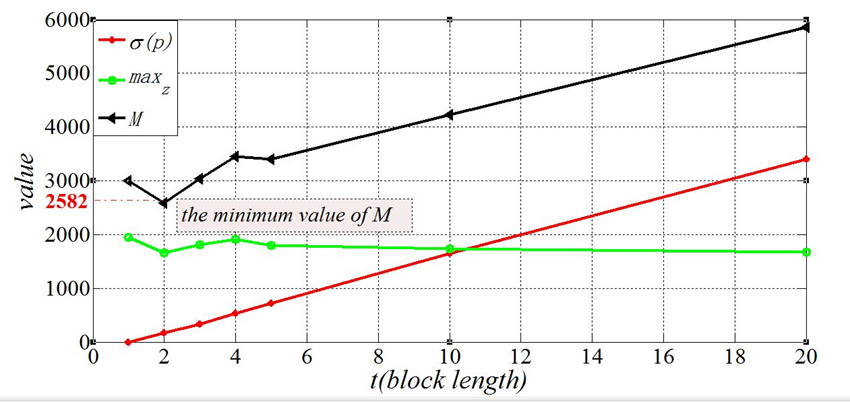
We can see from the figure that ,the minimum value of M is obtained at T = 2, at the same time, the change of T on the impact of the various indicators:
1. With the increasing of T , the order of evaluation indicators σ(p) into linear growth, increase the slope is 176.5;
2. A maximum height of Maxz in a trough when T = 2, after T > 4, with the increase of T changed little;
3. M value throughout the change is mainly influenced by sigma (p), there is the minimum when T = 2, M = 2582, after T > 5, with the increase of T, M value linear growth, growth slope was 163, slightly less than σ(p) the growth of the slope.
4.1.3 Compact degree of dIn order to avoid in the process of solving the search for unavailable space,we give up small space, and compact degree of d in the strategy’s influence on the results here are analyzing. Let T = 2 and K = 10, the results of the analysis is shown in Fig4.4:
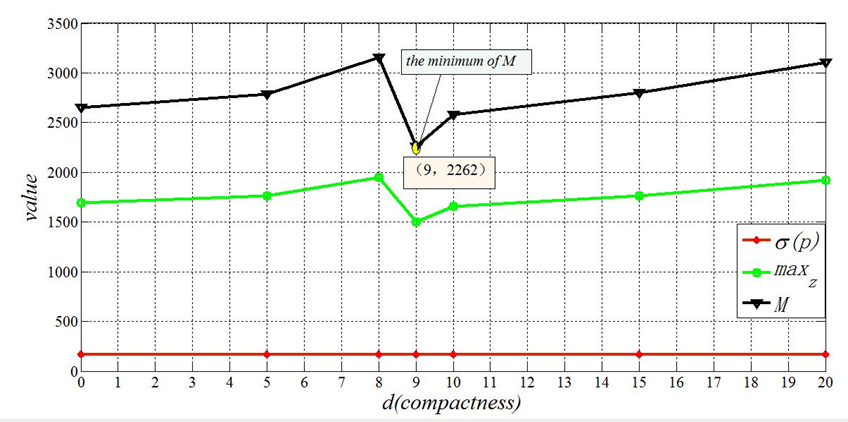
We can see from the figure that ,the minimum value of M is obtained at d = 9, at the same time, the change of d on the impact of the various indicators :
1. d has no effect on the size of σ(p);
2. A maximum height of Maxz in a trough when d = 9, after the height changes gradually increase;
3. M there was a minimum value in the d = 9, M = 2262, later along with the change of d, M value increases gradually, and change rate and Maxz tend to be the same.
4.2 Test results and analysis4.2.1 Best parameter result1. Classification boundary K = 10;
2. Length of group T = 2;
3. Compactness d = 9;
4.2.2 The analysis of the results• With the increase of packet length T, the M value will increase quickly, which shows that the length of the packet has a great influence on the order;
• With the increase of classification boundaries K, in the initial time sequence index σ(P) increased rapidly, because the present size mostly located within 10;
• The change of compactness d almost has no influence on the order. It is mainly to change the space utilization rate. There is a minimum d which satisfies the optimal space utilization rate, and that may decided by the distribution characteristics of presents own size.
5 Model applicationBecause1000,30000,100000 and1000000 presents size have the same statistical distribution,we can set the parameters as the best parameters in testing.Solution of the specific steps are as follows:
Step1:Set up parameters and input size and number of giftsT(block length)= 2, K(boundary)= 10,d(compactness)= 9,N = 30000
Step2:According to the classification boundary to the gift of classification, get gift placed number;
Step3:Search space and place the gift according to the model of the algorithm;
Step4:calculate M, output the result.
Table 5.1: Result![]()
N 30000 100000 1000000
σ(p) 4968 16553 165503
Maxz 25647 85090 848464 M 56261 186734 1862431![]()
Calculated results table at Tab5.1
As can be seen from the table, with the growth in the number of gifts, target showed a basic linear growth, this finding is helpful for large-scale gift space layout of the index forecast.
6 Strength and Weakness6.1 Strength• The model has a certain generality and expansibility, and can add the required constraints or change the display target, thus obtains the corresponding display method.
• The strategy is reasonable, and the utilization rate of the space is high according to the display mode.
6.2 Weakness• The stability problem in the process of model does not consider,so the results are different from the actual value.
• Computational complexity is larger,the data processing time is long.
References[1] Yuan Qu, Xuelian Wang. An efficient algorithm for three dimensional bin packig problem under complex condition. Hoisting and Conveying
Machinery,2007(8):48-51.
[2] Zeshuang Chen, Jianming He. More hybrid genetic algorithm for unconstrained three-dimensional container. Modern Computer,2001(1):14-18.
[3] Martello S, Pisinger D, Vigo D. The three packing pmblem. Operations Research, 2000(48):256-267.
[4] David Pisinger. Heuristics for the Container Loading Problem. European Journal of Operational Research 141 (2002): 382-392.
[5] Michael Eley. Solving Container Loading Problems by BlockArrangement. European Journal of Operational Research,141(2002):393-409.
[6] Kovalyov M Y, Ng C T,Cheng T C, et al. Single machine scheduling with a variable common due date and resource-dependent processing times[J]. Computer and Operations Research, 2003, 30:1173-1185.
Appendices
matlab source:
![]()
%******************************************************% %%%%%%%%%%%%%%%%%%%%%%%%%%%%%%%%%%%%%%%%%%%%%%%%%%%%%%%%
%source of data:data is derived from the faculty
%main method:iteration
%main steps of programming and purpose: every time we search the lowest
%place and available area, and try to put the given present.if can’t,we
%raise the height of the found area with the lowest height of bordered %place,and repeat the step until present can be put.
%%%%%%%%%%%%%%%%%%%%%%%%%%%%%%%%%%%%%%%%%%%%%%%%%%%%%%%%
%% input data
clear; clc; clf; load presents.mat;
%% parameter settings
total=30000;%total number of the presents to be delivered;
L_divide=10;% Length of group;
L_space=10;%Length of the unavailable space; L_group=10;%boundry
num_group=total/L_divide;%number of group;
%% initial
figure; hold on; colormap(jet(512)); axis equal; view([1 -1 1]); location=[];%record the coordinates of presents loaded hmap=zeros(1000,1000);%record the state of the box by it’s height count=0;%count the placed presents P=0;%count the defference
%% solute
%function find_min_height:find the coordinate of the lowest place
%fit_block:find a placing state of present to suit for the available place
%fillmap:fill the found place to raise its height avoiding being found
%again
for k=num_group-1:-1:0 %put the presents in inverted order for i=k*L_divide+L_divide:-1:k*L_divide+1 if min(presents(i,2:4))>L_group
% present of large size should be put first; flag=0; lmap=hmap; while(flag==0)
[x,h,len]=find_min_height(lmap); [flag,dem]=fit_block(lmap,x,len,presents(i,2:4)); if flag==0 if (len(1)<L_space || len(2)<L_space) hmap=fillmap(hmap,x,len);
%discard the narrow place to improve the efficiency of searching; end
lmap=fillmap(lmap,x,len);
%fill the tried area to avoid being found again; end
end hmap=renewmap(hmap,x,dem);
%update the height map after presents being put; location(i,1)=x(1); location(i,2)=x(2); location(i,3)=h;
%record the coordinates of presents put paint_block([x h],dem,randi(512));pause(0.1); count=count+1;
P=P+abs(total-count-i+1); M=P+2*max(max(hmap));
fprintf(’i=%d,M=%d,P=%d,Hmax=%d\n’,i,M,P,max(max(hmap)));
end endfor i=k*L_divide+L_divide:-1:k*L_divide+1 if min(presents(i,2:4))<=L_group flag=0; lmap=hmap; while(flag==0)
[x,h,len]=find_min_height(lmap);%v is priority
[flag,dem]=fit_block(lmap,x,len,presents(i,2:4));
if flag==0 if (len(1)<L_space || len(2)<L_space) hmap=fillmap(hmap,x,len); end
lmap=fillmap(lmap,x,len);
endend hmap=renewmap(hmap,x,dem); location(i,1)=x(1);location(i,2)=x(2);location(i,3)=h; paint_block([x h],dem,randi(512));pause(0.1); count=count+1;
P=P+abs(total-count-i+1); M=P+2*max(max(hmap));
fprintf(’i=%d,M=%d,P=%d,Hmax=%d\n’,i,M,P,max(max(hmap))); end
end endfunction paint_block(location,len,k)
%****************************************%
%function : paint cuboid
%parameter: location:coordinate; len:size of present; k:color parameter;
%****************************************% len=len-0.001;
X=[location(1) location(1)+len(1);location(1) location(1)+len(1)];
Y=[location(2) location(2);location(2)+len(2) location(2)+len(2)]; Z=[location(3) location(3);location(3) location(3)]; surf(X,Y,Z,ones(2,2).*k);
X=[location(1) location(1)+len(1);location(1) location(1)+len(1)];
Y=[location(2) location(2);location(2)+len(2) location(2)+len(2)];
Z=[location(3)+len(3) location(3)+len(3);location(3)+len(3) location(3)+len(3)];
surf(X,Y,Z,ones(2,2).*k);
Z=[location(3) location(3)+len(3);location(3) location(3)+len(3)];
X=[location(1) location(1);location(1)+len(1) location(1)+len(1)]; Y=[location(2) location(2);location(2) location(2)]; surf(X,Y,Z,ones(2,2).*k);
Z=[location(3) location(3)+len(3);location(3) location(3)+len(3)];
X=[location(1) location(1);location(1)+len(1) location(1)+len(1)];
Y=[location(2)+len(2) location(2)+len(2);location(2)+len(2) location(2)+len(2)];
surf(X,Y,Z),ones(2,2).*k;
Y=[location(2) location(2)+len(2);location(2) location(2)+len(2)];
Z=[location(3) location(3);location(3)+len(3) location(3)+len(3)]; X=[location(1) location(1);location(1) location(1)]; surf(X,Y,Z,ones(2,2).*k);
Y=[location(2) location(2)+len(2);location(2) location(2)+len(2)];
Z=[location(3) location(3);location(3)+len(3) location(3)+len(3)]; X=[location(1)+len(1) location(1)+len(1);location(1)+len(1) location(1)+len(1)];
surf(X,Y,Z,ones(2,2).*k);
function newmap=renewmap(hmap,x,presents)
%******************************************%
%function : update the map with the given present
%parameter: hmap:original height map; x:the coordinate of present to be
%put; presents:information of length,width and height;
%******************************************% h=max(max(hmap(x(1):x(1)+presents(1)-1,x(2):x(2)+presents(2)-1)))... +presents(3); hmap(x(1):x(1)+presents(1)-1,x(2):x(2)+presents(2)-1)=h; newmap=hmap;
function [flag,dem]=fit_block(hmap,x,len,presents)
%********************************************************%
%function:if a state of placement to put present can be find , return
%1 and its placement;if can’t, return 0;
%parameter:hmap:original height map; x:the coordinate of present to be
%put; len:size of given area; presents:information of length,width and
%height;
%*******************************************************% flag=0; if(presents(1)<presents(2)) temp=presents(1);presents(1)=presents(2);presents(2)=temp;
endif(presents(2)<presents(3)) temp=presents(2);presents(2)=presents(3);presents(3)=temp;
endif(presents(1)<presents(2)) temp=presents(1);presents(1)=presents(2);presents(2)=temp;
enddem=presents;
if(presents(1)<=len(1) && presents(2)<=len(2)) if all(hmap(x(1):x(1)+presents(1)-1,x(2):x(2)+presents(2)-1))...
<=hmap(x(1),x(2)) flag=1; return; end
endif(presents(2)<=len(1) && presents(1)<=len(2)) if all(hmap(x(1):x(1)+presents(2)-1,x(2):x(2)+presents(1)-1))...
<=hmap(x(1),x(2)) flag=1; dem(1)=presents(2); dem(2)=presents(1); return; end end
if(presents(3)<=len(1) && presents(1)<=len(2)) if all(hmap(x(1):x(1)+presents(3)-1,x(2):x(2)+presents(1)-1))...
<=hmap(x(1),x(2)) flag=1; dem(1)=presents(3); dem(2)=presents(1); dem(3)=presents(2); return; end
endif(presents(1)<=len(1) && presents(3)<=len(2)) if all(hmap(x(1):x(1)+presents(1)-1,x(2):x(2)+presents(3)-1))...
<=hmap(x(1),x(2)) flag=1; dem(1)=presents(1); dem(2)=presents(3); dem(3)=presents(2); return; end
endif(presents(2)<=len(1) && presents(3)<=len(2)) if all(hmap(x(1):x(1)+presents(2)-1,x(2):x(2)+presents(3)-1))...
<=hmap(x(1),x(2)) flag=1; dem(1)=presents(2); dem(2)=presents(3); dem(3)=presents(1); return; end
endif(presents(3)<=len(1) && presents(2)<=len(2)) if all(hmap(x(1):x(1)+presents(3)-1,x(2):x(2)+presents(2)-1))...
<=hmap(x(1),x(2)) flag=1; dem(1)=presents(3); dem(2)=presents(2); dem(3)=presents(1); return; end
endfunction [x h len]=find_min_height(map)
%********************************************%
%function : find the coordinate of the lowest place and search the
%available area;
%parameter introduction: x:coordinate;h:lowest height;len:size of
%available
%area;
%*******************************************% [a,b]=min(map);
[c,d]=min(a); x(2)=d; x(1)=b(d); h=c; len(1)=1; len(2)=1; while (x(1)+len(1)-1<=1000 && map(x(1)+len(1)-1,x(2))<=h) len(1)=len(1)+1; end len(1)=len(1)-1;
while (x(2)+len(2)-1<=1000 && all(map(x(1):x(1)+len(1)-1,x(2)...
+len(2)-1)<=h)) len(2)=len(2)+1; end
len(2)=len(2)-1;
function lhmap=fillmap(hmap,x,len)
%*****************************************%
%function : find the lowest height of block bordered,and fill the given
%area to raise it by the height
%parameter : hmap:original height map; x:the coordinate of present to be
%put; len:size of given area;
%****************************************% L=len(2); if x(1)==1 x0=1; else x0=x(1)-1;
endif x(1)+len(1)-1==1000 x1=1000; else x1=x(1)+len(1);
endif x(2)==1 y0=1; else y0=x(2)-1;
endif x(2)+len(2)-1==1000 y1=1000; else y1=x(2)+len(2); end
h=hmap(x(1),x(2))+65535; for i=x0:x1
for j=y0:y1 if hmap(i,j)˜=hmap(x(1),x(2))&&hmap(i,j)<h h=hmap(i,j);
end end endif x(1)˜=1 for i=x(2):x(2)+L-1 if hmap(x(1)-1,i)==hmap(x(1),i)
L=i-x(2);break; end
end endif x(1)+len(1)-1<1000 for i=x(2):x(2)+L-1 if hmap(x(1)+len(1),i)==hmap(x(1)+len(1)-1,i)
L=i-x(2);break; end
end endfor i=x(1):x(1)+len(1)-1 for j=x(2):x(2)+L-1 if hmap(i,j)<h hmap(i,j)=h;end
end end lhmap=hmap;
![]()


